

How Umi Matcha Turned a Niche Tea Into Repeatable Revenue
A D2C ceremonial matcha brand selling stone-ground Japanese green tea in an unfamiliar market. Ninety days of paid social, organic search and funnel repair delivered 12,000 reached users, a 22.7x test ROAS, and a compounding subscription base that runs without a discount.
Project Mandate & Overview
- Client
- Umi Matcha
- Industry / Sector
- D2C Food & Beverage
- Channels Managed
- Meta Ads, SEO, Shopify CRO, GA4 Analytics
- Timeline / Period
- Mar to Jul 2026
- Core Brief
- Build demand from zero, prove unit economics, and leave behind a self-sustaining system
01. The Problem
Selling a ritual, not a product
Umi Matcha sells stone-ground Japanese ceremonial matcha to an Indian market that mostly does not own a chasen, does not know Okumidori from Uji, and has been trained by cafes to think matcha is a sweetened latte powder.
That creates a specific commercial problem. You cannot buy your way into demand that does not exist yet, and you cannot educate profitably at cold-traffic prices. Every rupee has to do two jobs: teach the ritual, then sell the tin. Most matcha brands solve this by discounting, which trains the buyer to wait. We did not want that.
The brief to Adsmagnify was blunt. Build demand from zero, prove it converts on a real budget, and leave behind a system the founder can scale without us in the room.
02. First Proof
Nineteen days, ₹12,000, and a store that finally moved
We did not start with a scale budget. We started with a test small enough that failure would be cheap and success would be undeniable.
Between 26 March and 13 April 2026, a single tightly built Meta structure ran against roughly ₹12,000 in spend. The store closed ₹2,72,479 in gross sales across 91 orders, with a returning customer rate of 9.41% forming inside the same 19-day window. That last number mattered more to us than the revenue. Repeat purchase on a 19-day-old audience means the product survives first contact.
Exhibit A · Shopify Analytics Proof
22.7x blended ROAS (Total store revenue divided by Meta spend for the period). Organic, direct, and returning revenue are inside it.
03. The Engine
Meta became the front door, Reels became the doorbell
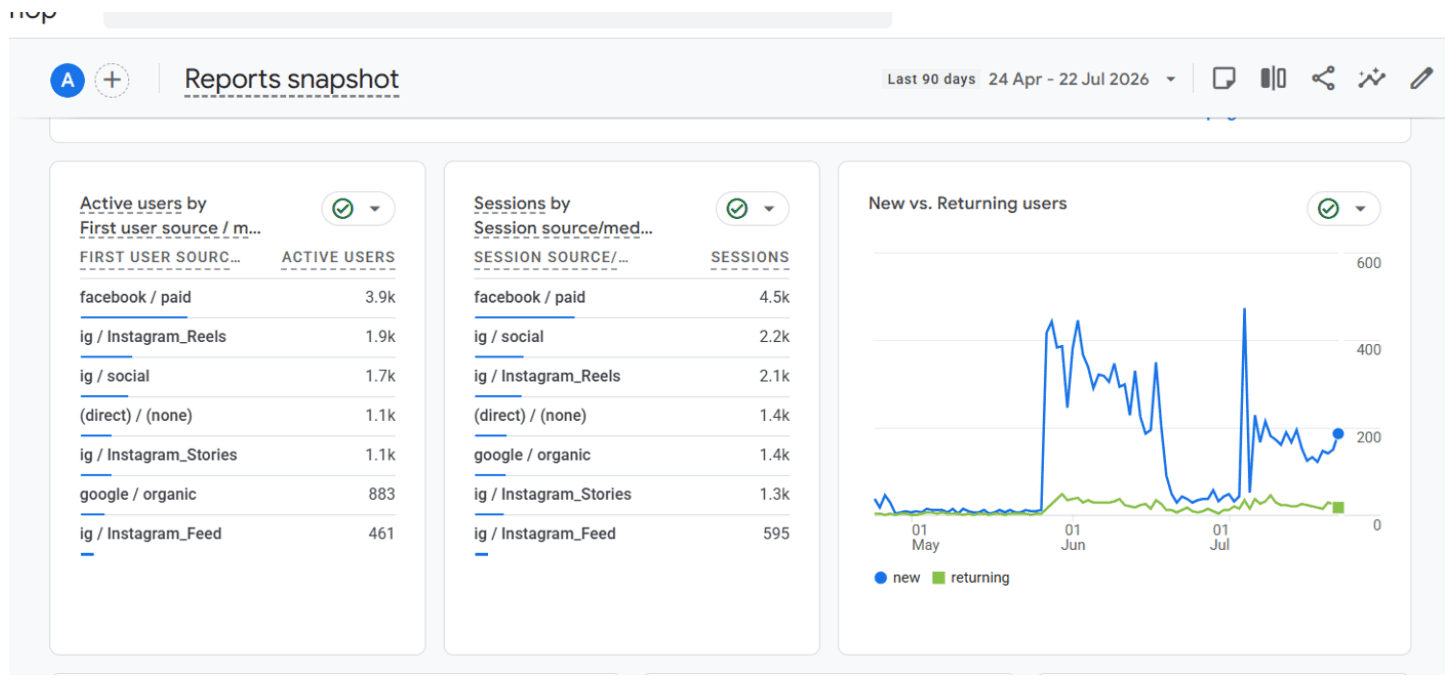
Once the test held, we widened the top of the funnel. Over the next 90 days the store pulled 12,000 users and 90,000 events, and the source mix tells you exactly who built that.
Roughly three in four first-time users arrived through the Meta ecosystem. Paid Facebook delivered 3,900 first-touch users and 4,500 sessions, the single largest source on the account. The organic Instagram surfaces were not passengers: Reels brought 1,900 first-touch users, Instagram social another 1,700, Stories 1,100, Feed 461. Paid found the audience. Reels made them stay.
The new versus returning curve shows the shape of a brand being built rather than rented. Two clean acquisition surges, one in late May and one in early July, each followed by a returning-user floor that does not fall back to zero.
Geography confirmed the thesis. Bengaluru led with 1,900 active users, ahead of Mumbai at 1,100 and Delhi at 838. Matcha in India is not a metro-wide behaviour yet. It is a specific wellness-literate, cafe-fluent buyer, and Bengaluru has the highest density of them. We stopped spending against a national footprint and started spending against seven cities.
04. The Compounding Layer
An article started outselling the shop page
Paid social buys attention. It does not accumulate. So in parallel we built the layer that does, and in the last month it overtook everything.
Across the full 90 days the ranked order of pages was predictable: Shop Matcha at 6,800 views, the homepage at 4,500, the Starter Kit at 4,200, and the editorial page Best Ceremonial Matcha Powder fourth at 3,600.
Now narrow to the last 28 days. That editorial page is number one on the entire site, with 2,500 views and 1,800 active users. Put differently: 69% of that page's 90-day traffic arrived in its final month. It is compounding like search. Average engagement time moved from 20s to 23s, and checkout bounce rate sits at 6.7% against 18.4% over the longer period.
Organic search delivered 883 first-touch users and 1,400 sessions across the 90-day window, entirely unbought.
05. The Diagnosis
Where the money was actually leaking: the 93.1% view-to-basket drop
A case study that only shows the wins is a brochure. Here is the part we spent most of our time on, because it is the part with the most money left in it.
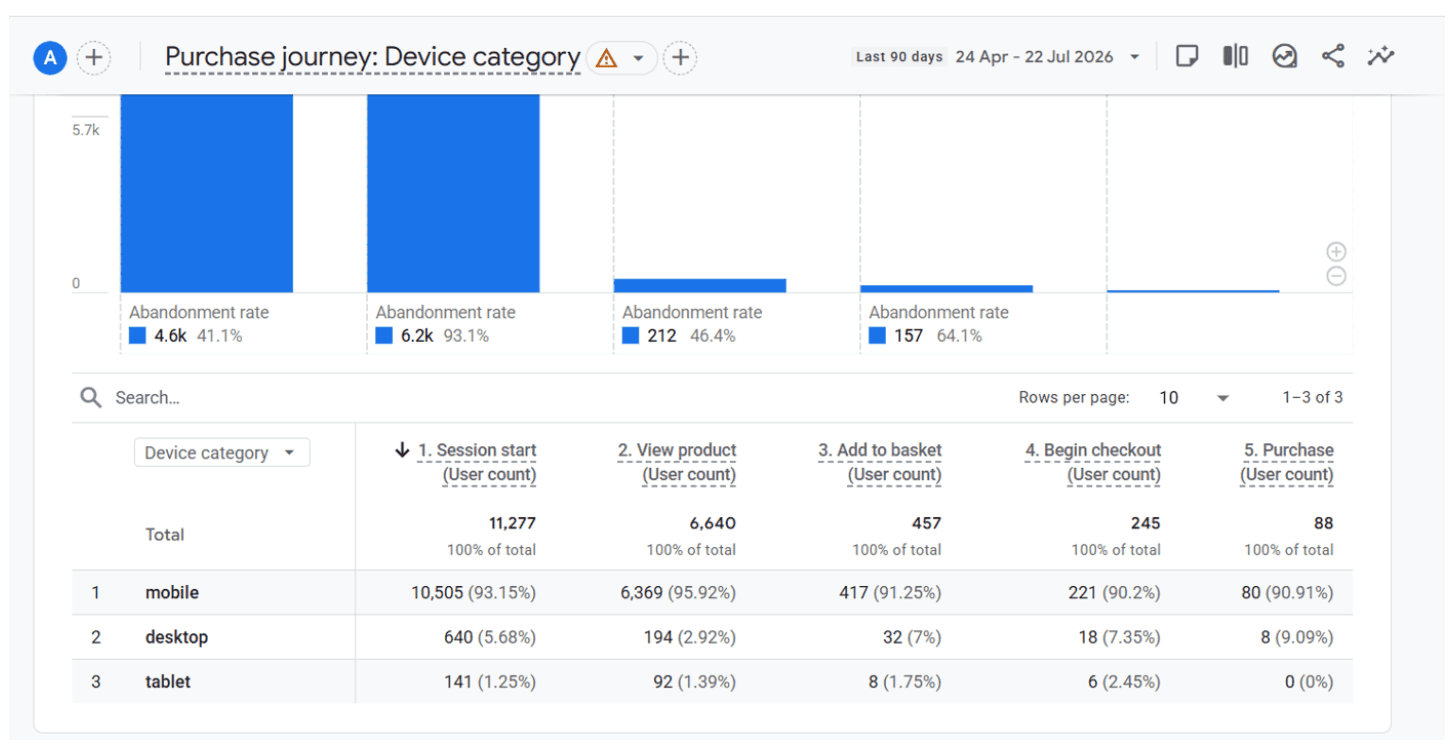
We mapped the full purchase journey by device across 90 days. Of 11,277 users who started a session, 88 purchased. The end-to-end rate is 0.78%. The loss is not evenly spread, and one stage is doing almost all the damage:
The Mobile Surface Fact
Mobile carried 93.15% of sessions and 90.91% of purchases. Tablet produced 141 sessions and zero purchases.
| Purchase Stage | Users Reached | Drop-off Rate | Users Lost |
|---|---|---|---|
| Session Start | 11,277 | 41.1% lost | 4,637 users |
| View Product | 6,640 | 93.1% lost | 6,183 users |
| Add to Basket | 457 | 46.4% lost | 212 users |
| Begin Checkout | 245 | 64.1% lost | 157 users |
| Purchase Completed | 88 | 0.78% full funnel completion | — |
06. The Diagnosis, Continued
Our best traffic was pointed at our worst converter
6,183 users looked at a product and did not add it. That is not a traffic problem or an ad problem. That is a product detail page problem: price framing against an unfamiliar category, no clarity on grade, and no answer on equipment.
The item-level data made the second diagnosis obvious:
Read the first and third rows together. The Essential Kit took 30.5% of all product views and returned 6.4% of revenue, and its landing page carries the worst bounce rate on the site at 66.3%. Meanwhile Nakai Okumidori took 12% of views and returned 32.2% of revenue, converting views to baskets eleven times better.
The starter kit was the hook. It should never have been the destination. Reallocating product-view traffic toward Okumidori and Haru at their existing conversion rates is the largest single revenue lever on the account.
| Product | Views | Added | Sold | Revenue | View to Basket |
|---|---|---|---|---|---|
| Matcha Essential Kit | 3,412 | 47 | 4 | ₹32,796 | 1.4% |
| Haru Matcha | 3,230 | 308 | 88 | ₹1,42,812 | 9.5% |
| Nakai Okumidori Matcha | 1,340 | 213 | 58 | ₹1,65,882 | 15.9% |
| Store Total | 11,178 | 1,723 | 271 | ₹5,14,970 | 15.4% |
Data & Sourcing Note: Every figure in this document is taken directly from Umi Matcha's Google Analytics 4 property and Shopify Analytics. No modelled, estimated or platform-attributed numbers have been introduced. Shopify figures cover 26 March to 13 April 2026. GA4 figures cover 24 April to 22 July 2026.
Key Strategic Principles
- 1Rebuild the product detail page for the 6,183: Grade explanation, ritual vs latte guidance, equipment answered above the fold, and price anchored per serving rather than per tin.
- 2Re-point traffic to the SKUs that convert: Move paid and internal-link traffic from the Essential Kit toward Okumidori and Haru. At Okumidori's 15.9% view-to-basket rate, 3,412 views yield ~540 basket adds instead of 47.
- 3Treat mobile as the only surface that matters: 93.15% of sessions and 90.91% of purchases are mobile. Tablet produced 141 sessions and zero orders and comes out of the bid.
- 4Scale the editorial layer that is already winning: The ceremonial matcha guide reached #1 on the site in 28 days at zero media cost. Extend it into topic clusters.
- 5Build retention against the 9.41%: Returning customer rate formed in 19 days without a loyalty program. A 45-day replenishment flow is the cheapest revenue on the account.
More Work
Explore other growth stories
The ₹30 Lakh Day: How a Fandom Brand Structures Its Meta Spend
A pop-culture merchandise brand with a fixed daily revenue target and a fixed daily media budget. No second channel to lean on, no monthly averaging to hide behind. This is how the ad account was built to carry it.
2640% Revenue Increase and 541% ATC Growth for a Clothing Brand
A fast-growing clothing brand came in at ₹10,000–₹50,000 monthly revenue. Full-funnel Meta campaigns took monthly revenue to ₹13,72,369, with 12,807 adds to cart and 2,394 purchases.
Imagine having an in-house creative lab testing 40+ winning ad hooks every month.
Stop watching customer acquisition costs double from creative burnout. The next step takes 15 minutes and could unlock your most profitable scaling quarter yet.